Pro Kapital Council approved Consolidated Interim Report for III Quarter and 9 Months of 2022 (Unaudited)
November 21, 2022
MANAGEMENT REPORT
CEO summary
The third quarter of 2022 continued the trend we have seen in Q2, with a strong demand for real estate assets in the Baltic countries (particularly Estonia and Lithuania).
The market still seems resilient, despite the negative sentiment caused by raising interest rates and an overall bearish outlook of the global economy.
Local and international investors still seem to have a strong interest in the Baltic area, especially in the premium properties segment.
After a few months where it seemed impossible to fix a price with construction companies, due to the volatility in the market of construction materials and supplies, there seem to be an increasing will from the local contractors to get back to work, even at the cost of partially absorbing the development risks, and the fluctuations in the cost of materials.
Real estate development
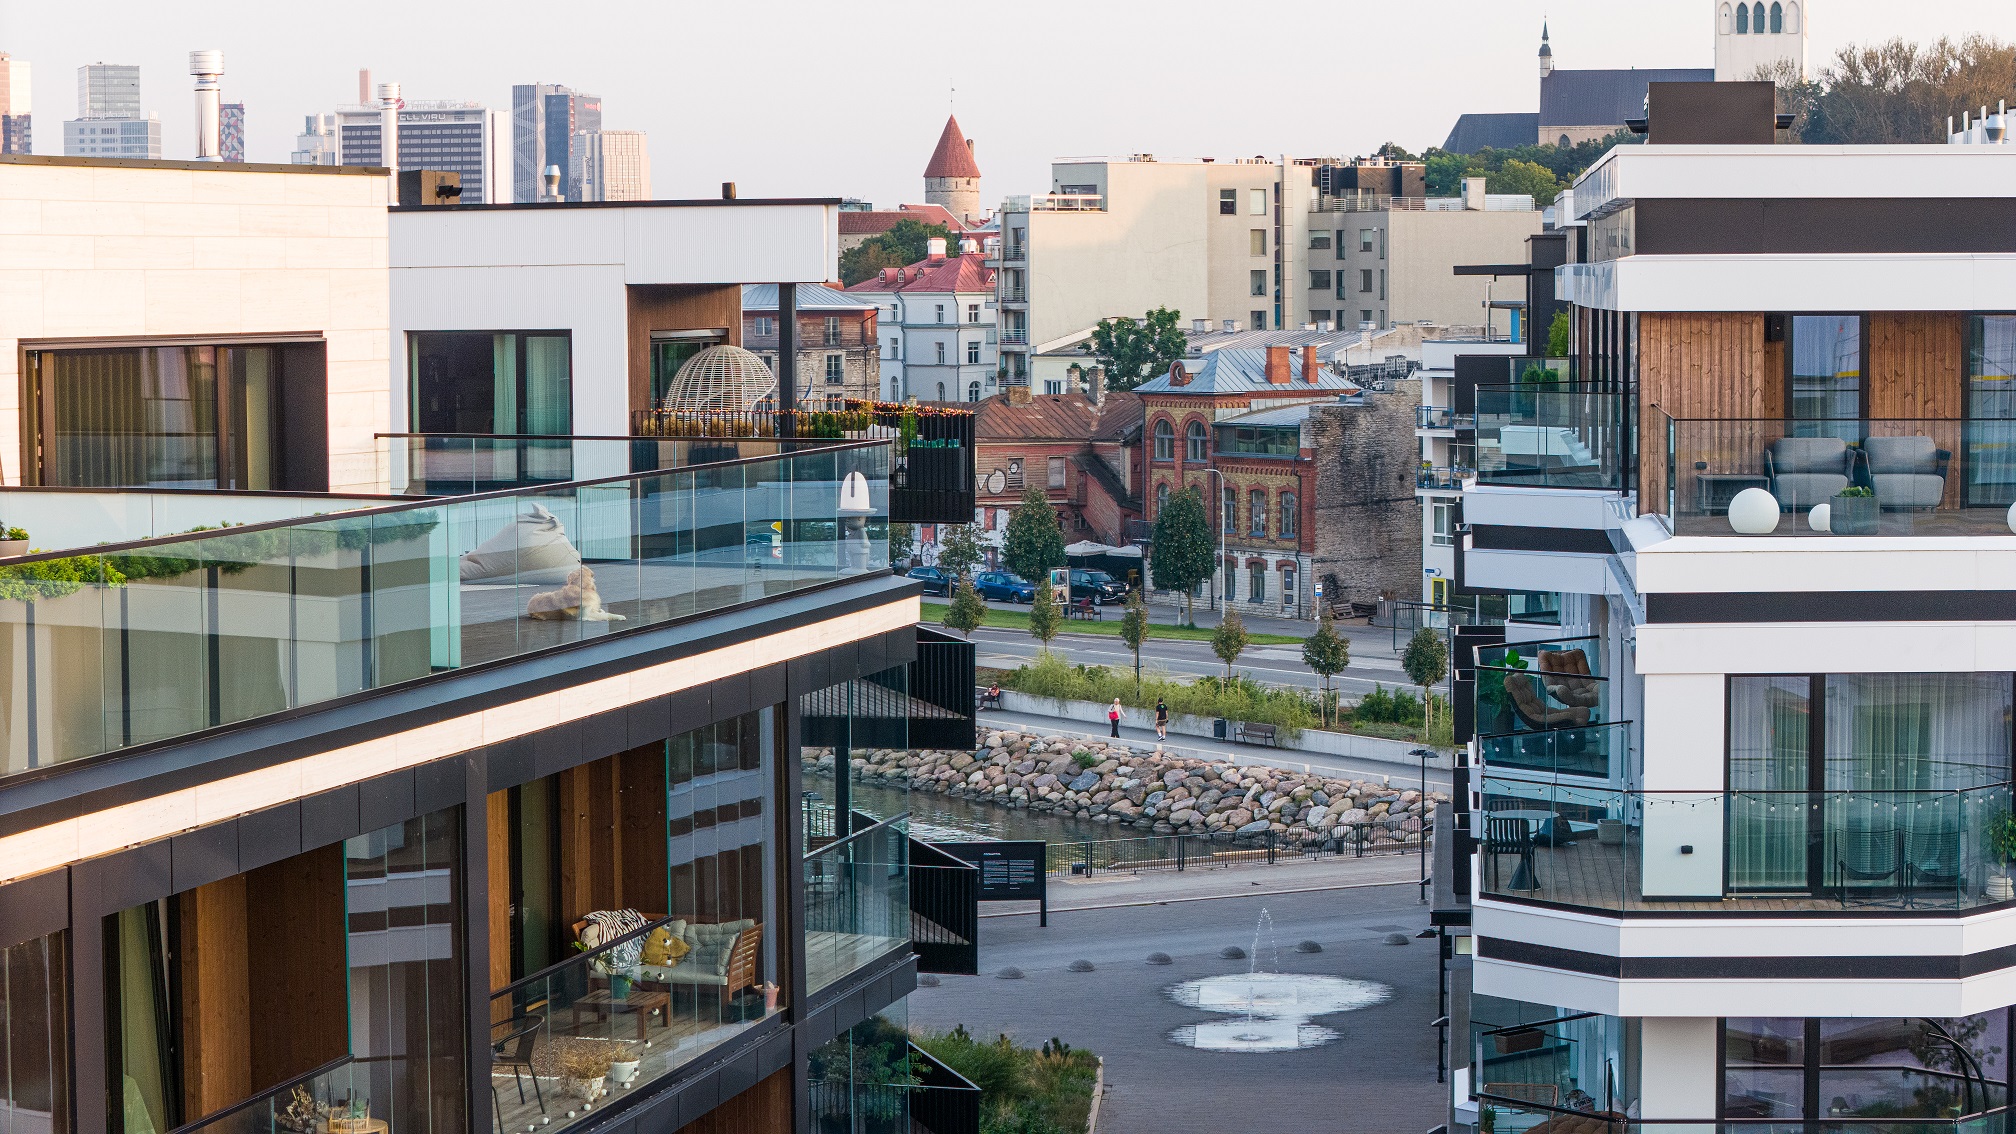
In Tallinn, we have continued construction of Kindrali Houses and Kalaranna projects.
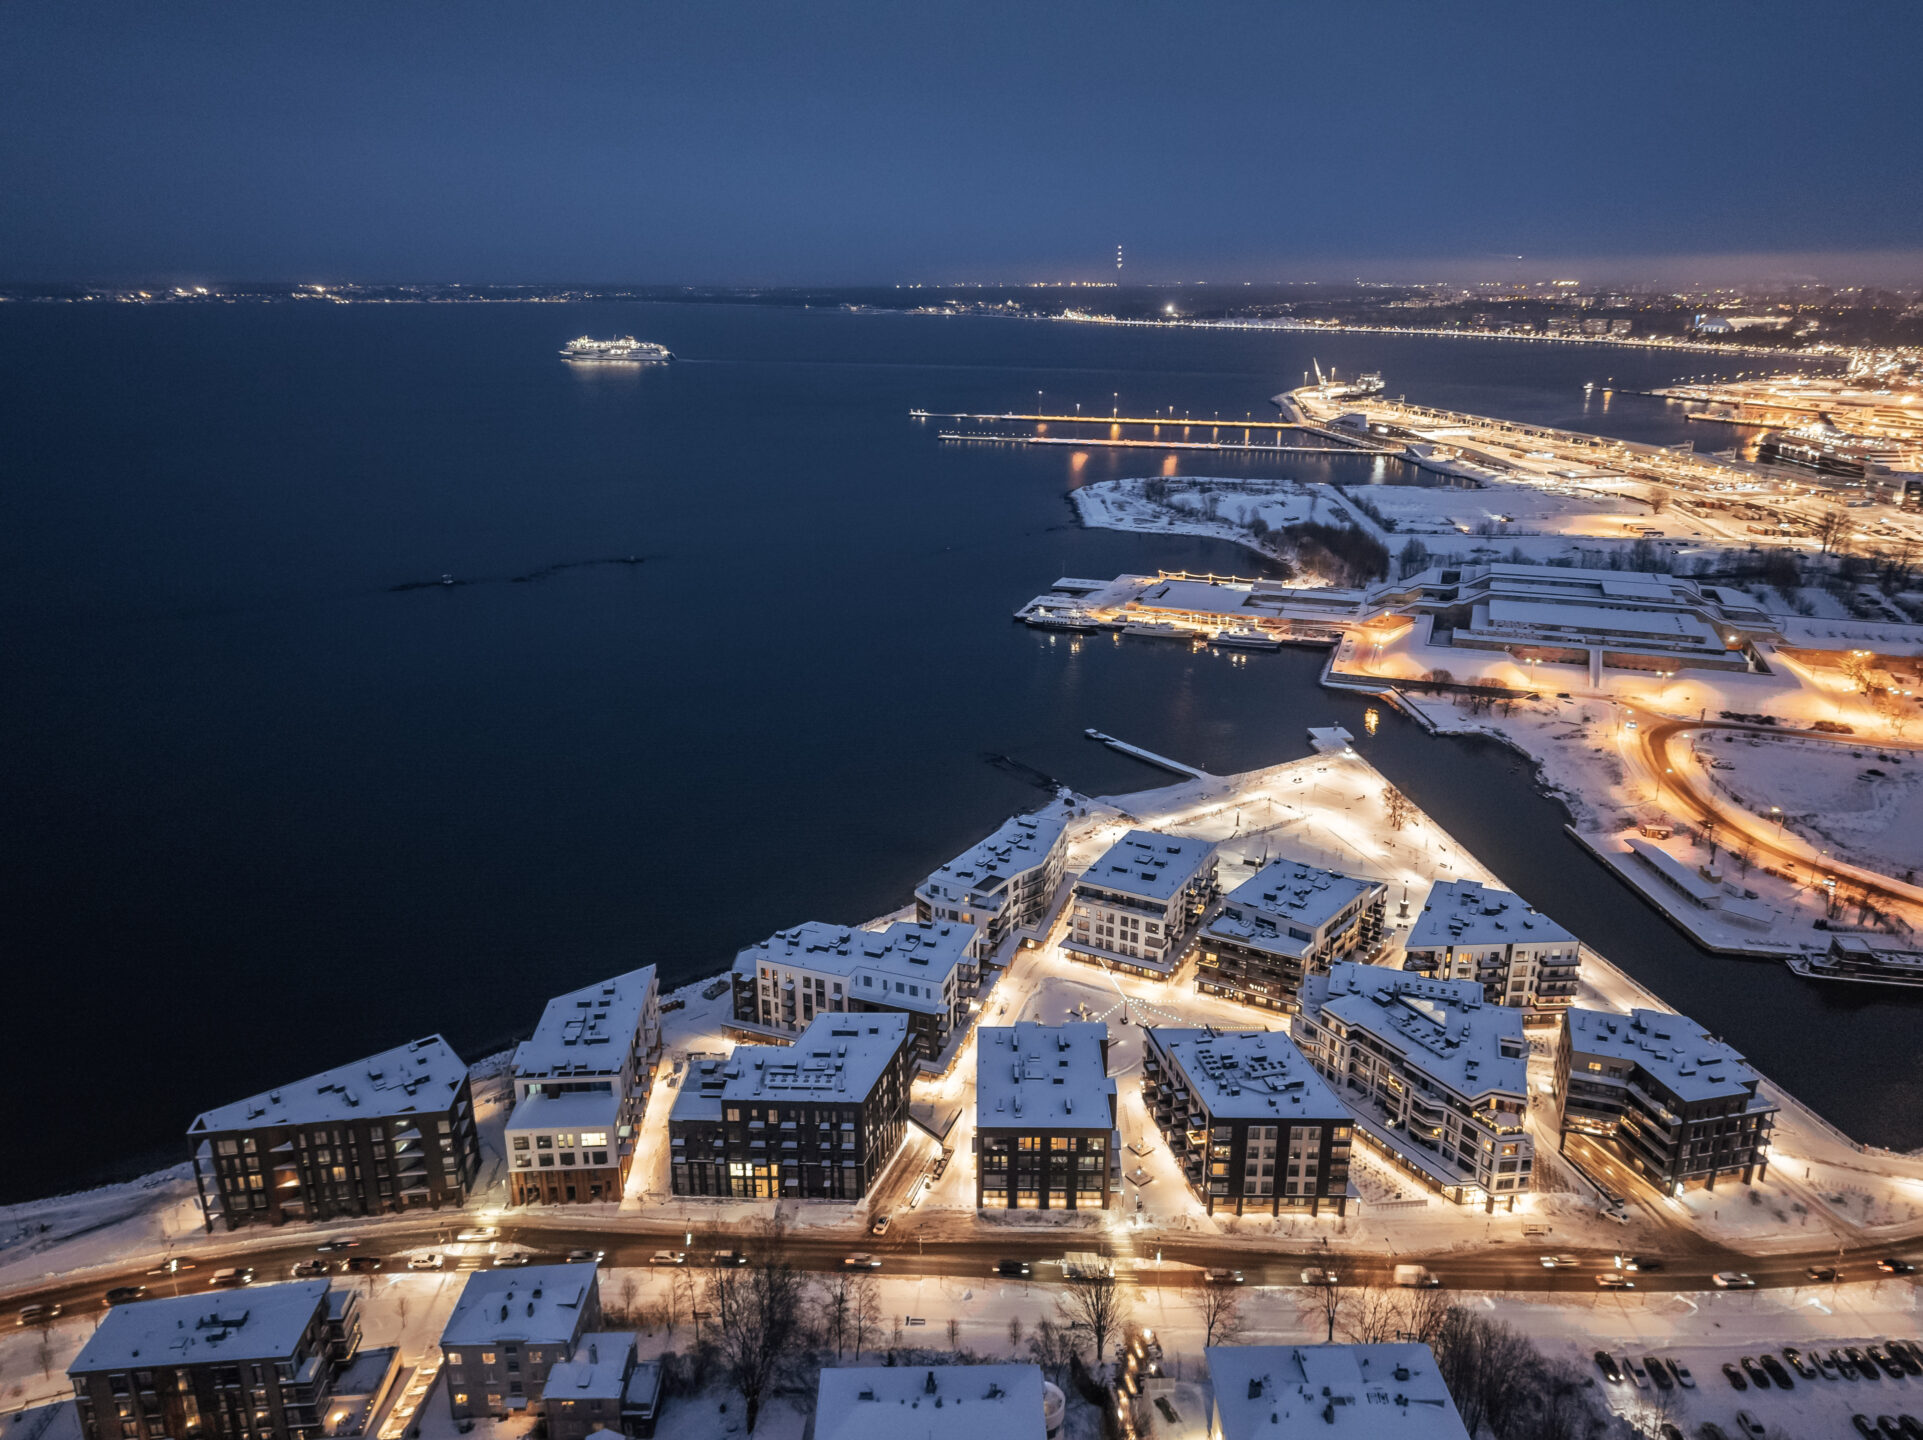
In Q3 of 2022 we finalised handing over all of the apartments in Kalaranna project, where completion of eight buildings with the total of 240 apartments is now achieved.
This first phase of the Kalaranna project has been a major success, and we are currently working alongside some local construction companies, who are studying the tender package. Our intention is to start the mobilisation of the site for the next phase of Kalaranna (four building for a total of 146 apartments) somewhere between Q1 and Q2 2023.
In Kindrali Houses, we have started the process of notarising deals in the first two buildings (black and white building), which have now reached completion. The third building (red building) is expected to be completed by the end of 2022. All in all, these three buildings comprise 195 residential and 1 commercial units, all of which are sold.
In Riga we are selling our ready luxury product River Breeze Residence and started the tendering process for the further development of Kliversala Residential Quarter – Blue Marine. We have received several offers from construction companies and are in the process of identifying the best option. The tendering process has taken longer since the company has decided to look into various value engineering options to mitigate the risk of increasing construction costs.
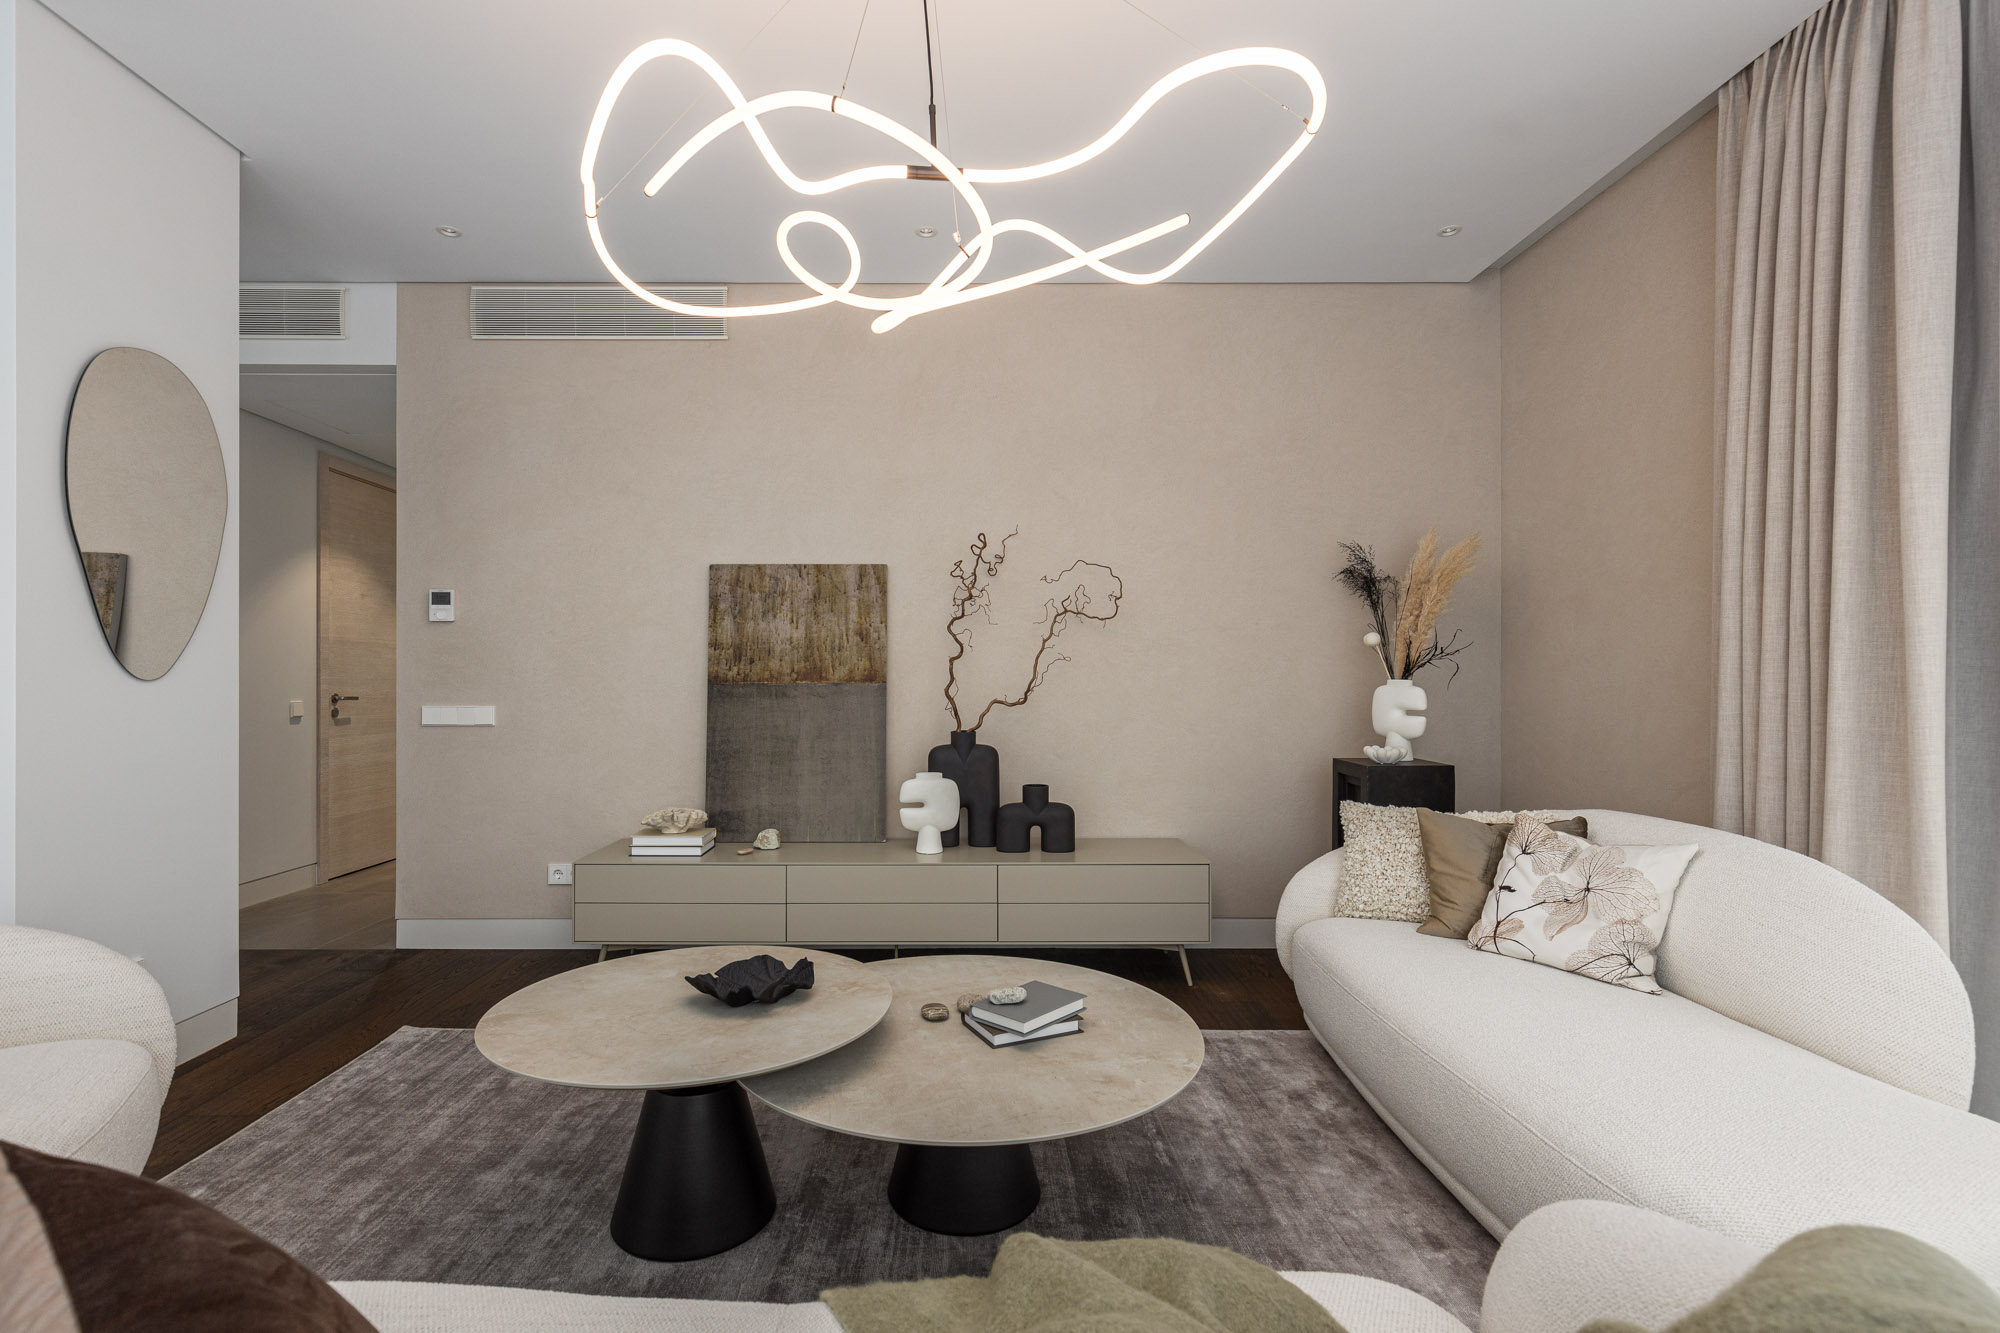
In Vilnius, we only have 4 unsold apartments in our Šaltiniu Namai Attico project (including one which serves as a showroom). The real estate market has had a great run in 2021 and we saw a great deal of interest for our luxury properties, achieving some of the highest prices per square meter in all the local market. The construction tendering for the following phase of city villas and a commercial building is now at its final stage are we are expecting to enter into an agreement with the winning bidder within November-December this year and start the construction works within the 1st quarter of 2023.
Hotel operations
We are in the process of renovation of the second half of the rooms (first half has been renovated 5 years ago), which will be completed by the end of the year. The works will also have the added benefit of converting an unused area into 7 standard rooms and creation of a luxurious suite with private sauna and terrace, which will greatly improve the overall prestige of the hotel.
Since the ongoing works, the hotel’s available inventory has been only at 50% for a good part of 2022. Despite this, in the first 9 months it has reached a substantial operative break-even, thanks to a) the MICE (Meetings, Incentives, Conferences and Exhibitions) coming back after a long pause due to the pandemic, and b) an increase in the Average Daily Rate (ADR) which is currently at 89.12 euro (September data), a substantial increase when compared to the 81.07 euro rate of September 2021.
In conclusion, we are confident in our abilities to navigate these turbulent times, thanks to our experience and to the resilience of the Baltic markets. We maintain our position to expand our current inventory, by making intelligent bets on what we feel like the market may absorb, thus creating long-term value for our shareholders and for the communities that we aim to develop in a sustainable, comfortable and aesthetically pleasing way.
Edoardo Preatoni
CEO
Key financials
The total revenue of the Company in nine months of 2022 was 61.6 million euros, having increased more than three times compared to the reference period (2021 9M: 19.4 million euros). The total revenue of the third quarter was 30.4 million euros compared to 12.1 million euros in 2021.
The gross profit for nine months of 2022 has increased three times amounting to 16.2 million euros compared to 5.3 million euros in 2021. The gross profit in the third quarter reached 6.8 million euros (2021 Q3: 3.4 million euros).
The operating result in nine months of 2022 has decreased to 12 million euros profit comparing to 31.2 million euros profit during the same period in 2021.The operating result of the third quarter was 5.6 million euros comparing to 2.8 million euros in 2021. Higher profit in 2021 was affected by one-time sales of investment property and related revenue and by the results of derecognition of AS Tallinna Moekombinaat after loss of control over the subsidiary on 2 June 2021.
The net result for the nine months of 2022 was 8.7 million euros profit, comparing to 22.5 million euros (continuing operations 26.5 million euros) profit in the reference period. The net profit of the third quarter was 4.5 million euros comparing to 1.1 million euros generated in 2021.
Cash generated in operating activities during nine months of 2022 was 25.8 million euros comparing to 1.4 million euros during the same period in 2021. In the third quarter cash generated in operating activities was 14.6 million euros comparing to 5.2 million euros in 2021.
Net assets per share on 30 September 2022 totalled to 0.91 euros compared to 0.63 euros on 30 September 2021.
Key performance indicators
| 2022 9M | 2021 9M | 2022 Q3 | 2021 Q3 | 2021 12M | |
| Revenue, th EUR | 61 628 | 19 373 | 30 434 | 12 066 | 43 095 |
| Gross profit, th EUR | 16 211 | 5 255 | 6 849 | 3 442 | 10 576 |
| Gross profit, % | 26% | 27% | 23% | 29% | 25% |
| Operating result, th EUR | 11 990 | 31 152 | 5 577 | 2 836 | 39 820 |
| Operating result, % | 19% | 161% | 18% | 24% | 92% |
| Net result, th EUR | 8 651 | 22 463 | 4 546 | 1 123 | 29 757 |
| Net result, % | 14% | 116% | 15% | 9% | 69% |
| Earnings per share, EUR | 0.15 | 0.40 | 0.08 | 0.02 | 0.52 |
| 30.09.2022 | 30.09.2021 | 31.12.2021 | |
| Total Assets, th EUR | 99 731 | 125 042 | 116 026 |
| Total Liabilities, th EUR | 48 237 | 89 493 | 73 183 |
| Total Equity, th EUR | 51 494 | 35 549 | 42 843 |
| Debt / Equity * | 0.94 | 2.52 | 1.71 |
| Return on Assets, % ** | 6.2% | 14.8% | 23.7% |
| Return on Equity, % *** | 28.3% | 99.5% | 113.5% |
| Net asset value per share, EUR **** | 0.91 | 0.63 | 0.76 |
*debt / equity = total debt / total equity
**return on assets = net profit/loss / total average assets
***return on equity = net profit/loss / total average equity
****net asset value per share = net equity / number of shares
CONSOLIDATED FINANCIAL STATEMENTS
Consolidated interim statement of financial position
| in thousands of euros | 30.09.2022 | 30.09.2021 | 31.12.2021 |
| ASSETS | |||
| Current assets | |||
| Cash and cash equivalents | 11 088 | 13 283 | 9 626 |
| Current receivables | 1 648 | 1 458 | 802 |
| Inventories | 35 228 | 67 811 | 57 533 |
| Total current assets | 47 964 | 82 552 | 67 961 |
| Non-current assets | |||
| Non-current receivables | 2 017 | 23 | 21 |
| Property, plant and equipment | 7 901 | 6 677 | 6 754 |
| Right-of-use assets | 229 | 233 | 202 |
| Investment property | 41 270 | 35 202 | 40 734 |
| Intangible assets | 350 | 354 | 354 |
| Total non-current assets | 51 767 | 42 490 | 48 065 |
| TOTAL ASSETS | 99 731 | 125 042 | 116 026 |
| LIABILITIES AND EQUITY | |||
| Current liabilities | |||
| Current debt | 368 | 530 | 3 955 |
| Customer advances | 2 614 | 13 516 | 12 419 |
| Current payables | 4 308 | 5 233 | 7 297 |
| Tax liabilities | 958 | 656 | 1 143 |
| Short-term provisions | 662 | 534 | 713 |
| Total current liabilities | 8 910 | 20 469 | 25 527 |
| Non-current liabilities | |||
| Long-term debt | 38 153 | 64 708 | 46 455 |
| Other non-current payables | 0 | 3 139 | 20 |
| Deferred income tax liabilities | 1 138 | 1 133 | 1 133 |
| Long-term provisions | 36 | 44 | 48 |
| Total non-current liabilities | 39 327 | 69 024 | 47 656 |
| TOTAL LIABILITIES | 48 237 | 89 493 | 73 183 |
| Equity attributable to owners of the Company | |||
| Share capital in nominal value | 11 338 | 11 338 | 11 338 |
| Share premium | 5 661 | 5 661 | 1 748 |
| Statutory reserve | 1 134 | 1 134 | 0 |
| Revaluation reserve | 2 984 | 2 984 | 2 984 |
| Retained earnings | 21 726 | -8 031 | 0 |
| Profit/ Loss for the period | 8 651 | 22 463 | 26 773 |
| Total equity attributable to owners of the Company |
51 494 | 35 549 | 42 843 |
| TOTAL EQUITY | 51 494 | 35 549 | 42 843 |
| TOTAL LIABILITIES AND EQUITY | 99 731 | 125 042 | 116 026 |
Consolidated interim statements of comprehensive income
| in thousands of euros | 2022 9M | 2021 9M | 2022 Q3 | 2021 Q3 | 2021 12M |
| CONTINUING OPERATIONS | |||||
| Operating income | |||||
| Revenue | 61 628 | 19 373 | 30 434 | 12 066 | 43 095 |
| Cost of goods sold | -45 417 | -14 118 | -23 585 | -8 624 | -32 519 |
| Gross profit | 16 211 | 5 255 | 6 849 | 3 442 | 10 576 |
| Marketing expenses | -345 | -358 | -108 | -119 | -502 |
| Administrative expenses | -3 743 | -3 549 | -1 085 | -1 086 | -5 592 |
| Other income | 9 | 29 860 | 1 | 605 | 35 615 |
| Other expenses | -142 | -56 | -80 | -6 | -277 |
| Operating profit/ loss | 11 190 | 31 152 | 5 577 | 2 836 | 39 820 |
| Financial income | 2 | 5 | 1 | 2 | 6 |
| Financial expense | -3 336 | -4 556 | -1 032 | -1 722 | -5 964 |
| Profit / loss before income tax | 8 656 | 26 601 | 4 546 | 1 116 | 33 862 |
| Income tax | -5 | -23 | 0 | 6 | 10 |
| Net profit / loss from continuing operations | 8 651 | 26 578 | 4 546 | 1 122 | 33 872 |
| Profit from discontinued operations | 0 | -4 115 | 0 | 0 | -4 115 |
| Net profit / loss for the period | 8 651 | 22 463 | 4 546 | 1 122 | 29 757 |
| Attributable to: | |||||
| Equity holders of the parent | 8 651 | 22 463 | 4 546 | 1 122 | 29 757 |
| Total comprehensive income / loss for the year | 8 651 | 22 463 | 4 546 | 1 122 | 29 757 |
| Attributable to: | |||||
| Equity holders of the parent | 8 651 | 22 463 | 4 546 | 1 122 | 29 757 |
| Earnings per share (continuing operations) € | 0.15 | 0.47 | 0.08 | 0.02 | 0.60 |
| Earnings per share for the period € | 0.15 | 0.40 | 0.08 | 0.02 | 0.52 |
The full report can be found in the stock exchange announcement.
